Three Applications of GIS in the AEC Industry
Geographical Information Systems (GIS) are fast becoming one of the most powerful tools available to professionals throughout the AEC industry. Whether it’s being used to analyze traffic patterns for transportation route planning or to monitor watershed data in flood-prone areas, usage can be seen across a broad range of fields and disciplines. But what are some of the various GIS applications in the AEC industry at large?
In honor of National GIS Day, we sat down with GIS Analyst Katherine R. and GIS Specialist Emily P. to talk through the tools and technologies we currently utilize to stay on top of this versatile technology and bring it’s many benefits to our clients in the public and private sectors alike.
What is GIS?
Geographical Information Systems are digital tools that allow us to collect, visualize, manage, and analyze data tied to physical location data. In short, it takes data and ties it to a corresponding physical location, often using maps or other visualizations. GIS brings out patterns, trends, and relationships between data points that may not be obvious without this method of collection and visualization.
GIS has numerous applications, even within the confines of the AEC industry. Among these applications are pavement condition assessments, existing conditions reports and data analysis, and field work coordination. GIS dashboards, such as the ones demonstrated below, can be put together by our analysts to help translate the data into usable insights and conclusions, which can drive clients—be they municipalities, government entities, or private interests alike—towards better, more informed decisions.
Within the AEC industry, and especially at Summit, there are three standout functions of GIS and its utilization: Data Collection and Management, Spatial Analysis and Investigation, and Mapping and Visualization.
Three Functions of GIS in the AEC industry
Using GIS for Data Collection & Management
When it comes to GIS work, field data collection makes up the foundation for everything else that follows. Nearly every project begins with accurate, high-quality spatial information, which is something that departments like our Survey department excel at. Using a combination of hardware, such as aerial drones and GNSS receivers, alongside software, such as ArcGIS, our GIS specialists and analysists can not only capture what’s on the ground with a high degree of precision but translate those images into usable data.
But how does that data then benefit our clients? For a large majority of our clients, the data benefits them through things like dashboards. The data can take many shapes, and serve numerous purposes. One such example includes Summit’s work with Pavement Condition Surveys.
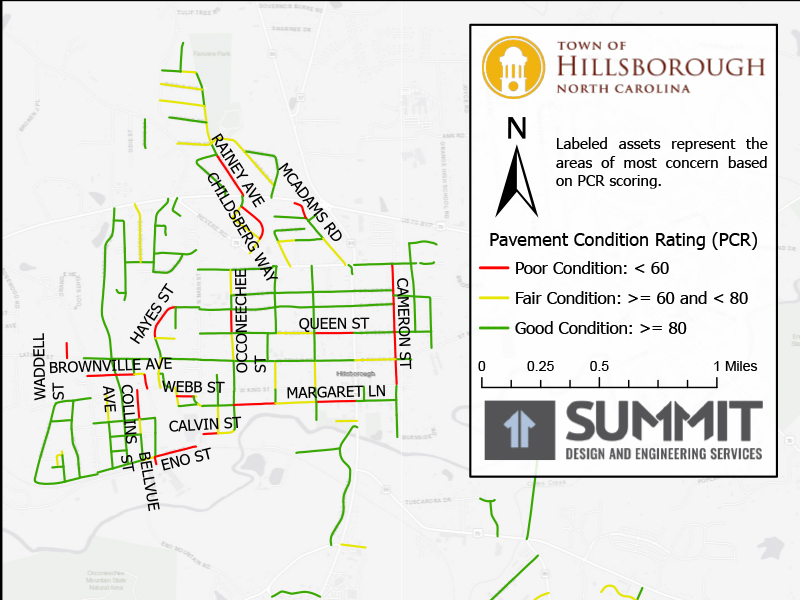
GIS Roadway Map for the Hillsborough Pavement Preservation Project, displaying the various pavement assessments using color-coding for ease of understanding.
For many of our municipal pavement condition studies, field crews move segment by segment through a street network, rating the condition of each roadway based on standardized criteria. Using the ArcGIS Field Maps interface allows these workers to enter information directly into a mobile form, while built-in validation ensures nothing is missed. These ratings show up on digital maps as highlighted lines, each one using a different color to denote their ranking. This way, with a quick glance at a dashboard, a broad overview of the pavement conditions can be made simply by looking at the corresponding colors. Assets can be tagged, labeled, categorized, and more, with data going into fields that correspond with these digital tags.
High-accuracy GNSS receivers play a critical role as well.
- The Emlid receivers perform well even under tree cover, near utility lines, or around other signal interferences, delivering sub-inch accuracy (a global positioning accuracy within 2.5cms) that is essential for mapping utilities or documenting construction progress.
- The Bad Elf receivers offer solid performance in more open, rural environments, such as solar farms.
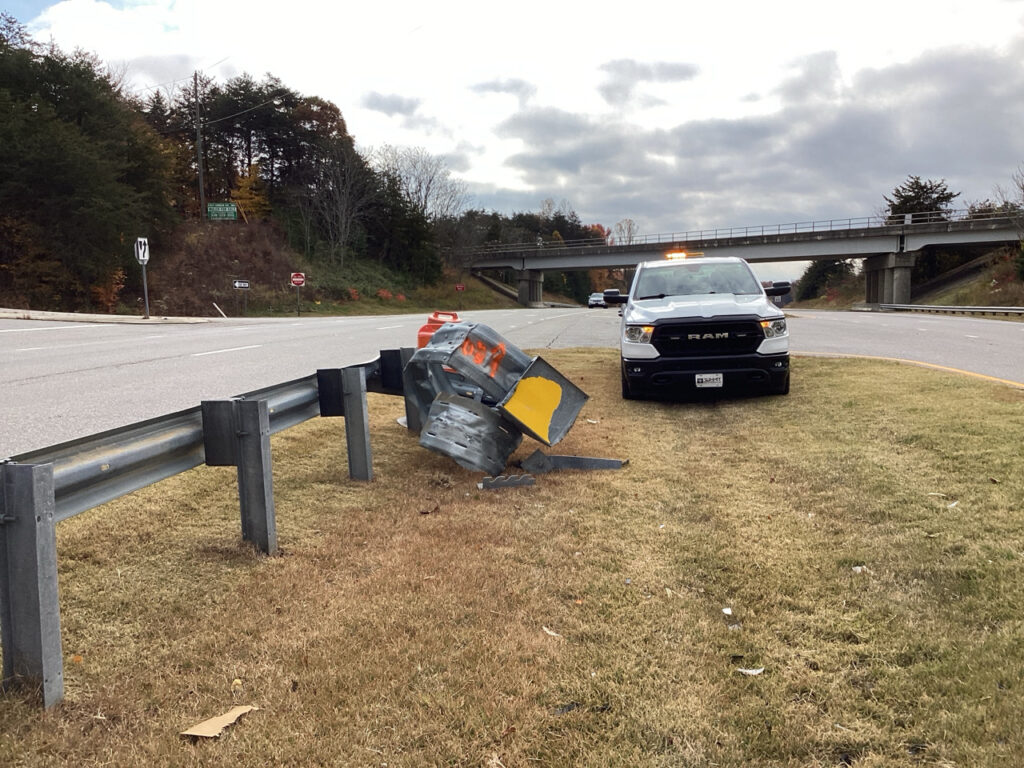
Our staff relies on this combination of mobile tools and GNSS technology to pinpoint features key to our work. These features include locating fiber optic points, recording guardrail impacts, or updating construction status in the field.
Drones add another dimension to data collection. On long-term construction projects, our drone program regularly flies over sites to document utility installation and site changes over time. The aerial imagery is then paired with GNSS-collected points to create accurate visual records. These flights are especially valuable on long-running construction efforts, where frequent updates give project teams a clear picture of progress.
Using GIS for Data Collection & Management
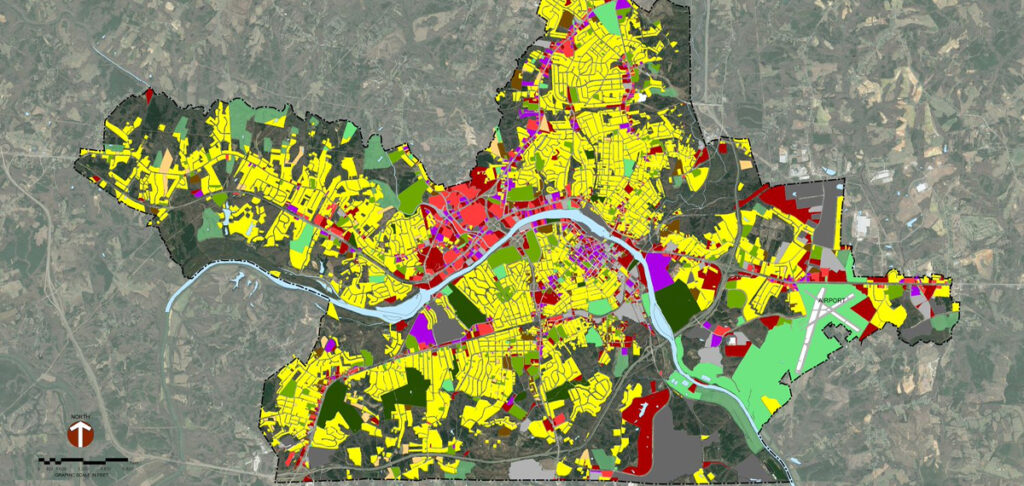
Once high-quality data is collected, GIS becomes a powerful engine for deeper analysis by helping our teams move beyond mapping features and towards understanding patterns, relationships, and long-term trends. The conclusions drawn from this data often form the basis for decision making, contribute to site planning, and inform project execution.
Much of this work happens in ArcGIS Desktop. For example, in our pavement condition program, the desktop environment automatically calculates Pavement Condition Ratings (PCRs) based on the values collected in the field. Instead of evaluating each segment manually, GIS applies consistent formulas that convert raw observations into “scores” that can be more widely applied and universally understood.
One of the most compelling examples of this kind of data processing at work can be seen in our guardrail hotspot detection. Rather than viewing guardrail impacts one point at a time (a method that can obscure trends), five years of statewide data was combined into a single, color-graded hotspot map. The result revealed patterns that daily inspection summaries were not able to show on their own. Using this method meant that unexpected clusters of impacts immediately stood out, prompting deeper investigation and insight into the relationship between the roadway and the impacts to the guardrail.
Guardrail Inspections in Motion
How does this help make decisions? By revealing trends, relevant questions can be asked. In the example above, a guardrail that faces significant impact volume might prompt the question: why? Is there not enough visibility, or is there a design element lending to the increased number of collisions? Once an anomaly is identified, solutions can be put forth to address the now-visible problem.
GIS for Data Visualization and Decision-Making
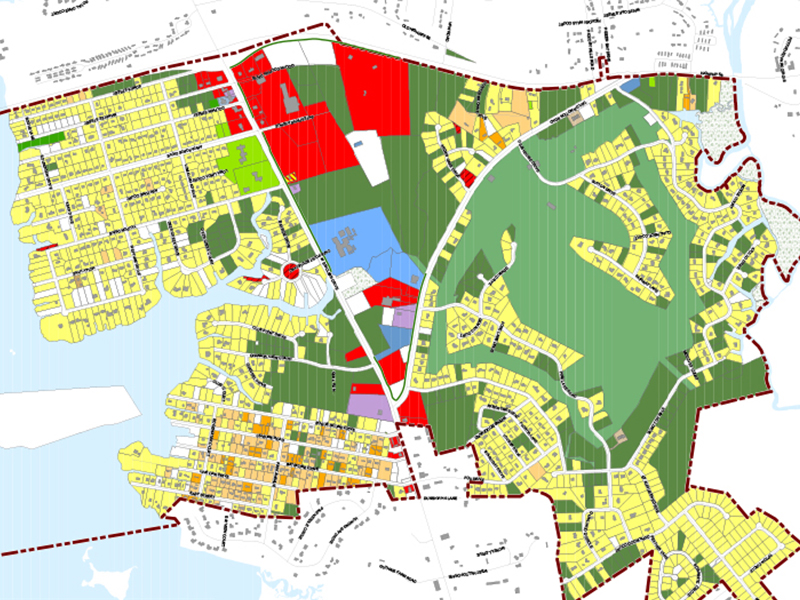
Data visualization is where GIS becomes truly accessible to clients, field crews, and anyone who needs a clear picture of what’s happening on a project. Once the data has been collected and analyzed, our GIS team translates it into intuitive, visual tools that support faster, smarter decision-making.
A major part of this work happens in ArcGIS Online, where information is transformed into web maps, dashboards, and interactive applications. These platforms allow clients to explore their data in real time rather than waiting for static PDFs, which may be difficult to read or might present problems with visualization.
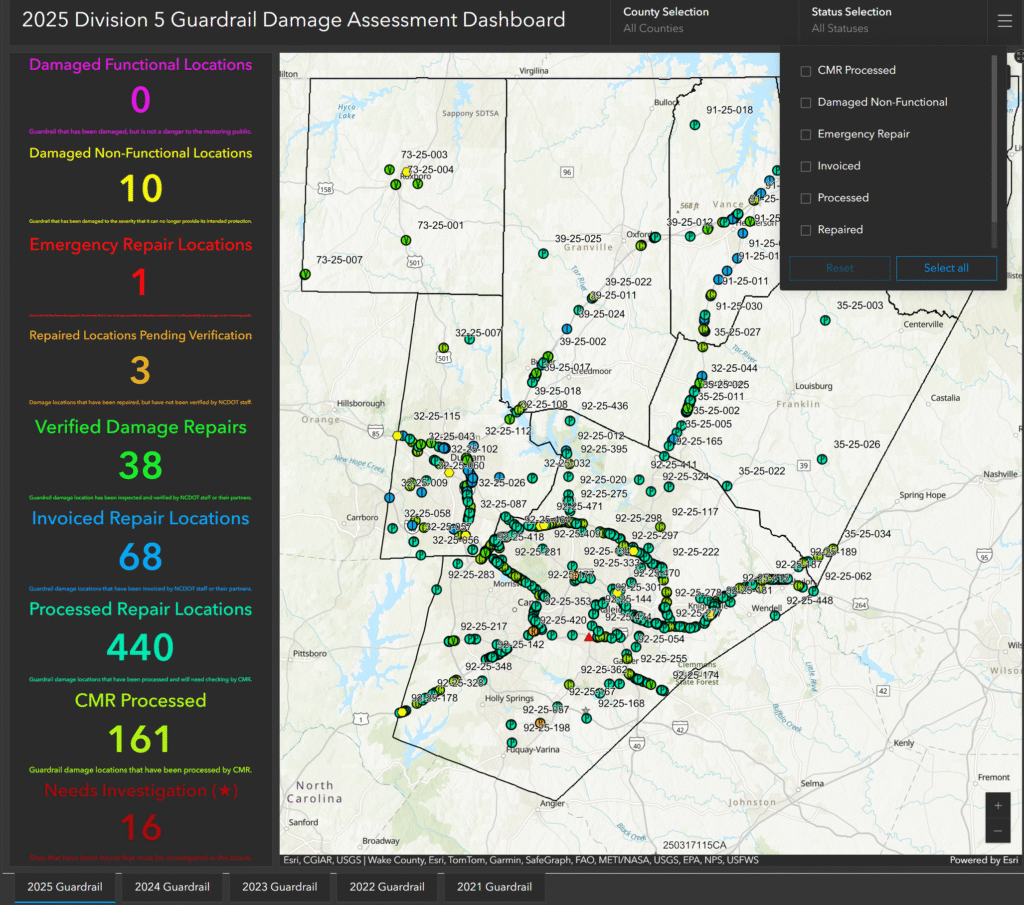
The Guardrail Damage Dashboard
The dashboard that can be developed for clients has the ability to display discrepancy logs, photos, notes, data points, and even plan sheets in a centralized, map-based interface. Inspectors in the field can update statuses directly from their tablets, and those updates appear immediately in the dashboard. Because everything is tied to location, project teams can quickly verify whether work aligns with design plans.
Visualization also bridges the gap between aerial perspectives and ground-level details. For example, when drone imagery is layered with GNSS-collected utility points, clients gain the ability to see site changes at a glance. These overlays turn complex datasets into easy-to-understand snapshots of what has been installed, what still needs attention, and how the site is evolving over time.
In Summary
Whether it’s identifying long-term guardrail safety trends, tracking construction progress in real time, mapping utilities with sub-inch precision, or giving municipalities clear snapshots of their pavement conditions, the various GIS applications in the AEC industry strengthens every stage of a project. GIS becomes more than technology in the hands of our specialists; it’s an essential part of how Summit approaches some of our engineering, planning, survey work, and more. By combining these powerful data collection tools with the skills our GIS analysist and specialists possess, our GIS team is able to support the ideal outcomes for our clients, improving projects– and our communities– through every contribution they make to projects.